

REIT Performance
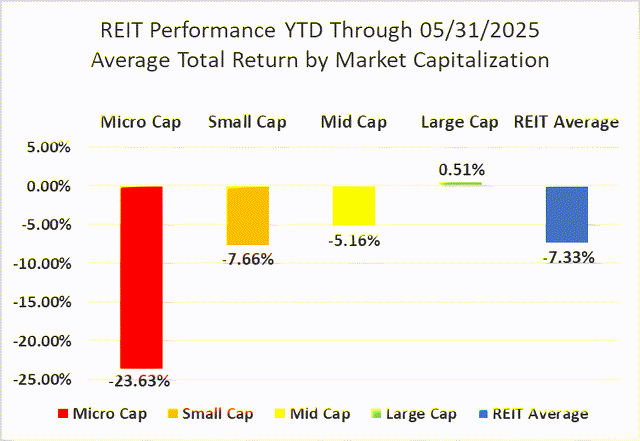
After back-to-back months in the red, REITs rebounded in May with a solid +2.08% average total return. However, the REIT sector’s gains fell far short of the broader market with strong gains from the Dow Jones Industrial Average (+4.2%), S&P 500 (+6.3%) and NASDAQ (+9.6%). The market cap weighted Vanguard Real Estate Index Fund ETF (VNQ) fell short of the average REIT in May (+1.12% vs. +2.08%), but has handily outperformed year-to-date (+1.31% vs. -7.33%). The spread between the 2025 FFO multiples of large cap REITs (17.8x) and small cap REITs (12.9x) widened in May as multiples expanded 0.3 turns for large caps but held steady for small caps. Investors currently need to pay an average of 38% more for each dollar of FFO from large cap REITs relative to small cap REITs. In this monthly publication, I will provide REIT data on numerous metrics to help readers identify which property types and individual securities currently offer the best opportunities to achieve their investment goals.
Source: Graph by Simon Bowler of 2nd Market Capital, Data compiled from S&P Global Market Intelligence LLC. See important notes and disclosures at the end of this article
Micro cap REITs (-0.73%) continued to underperform their larger peers for the 7th straight month. Small caps (+4.28%) outperformed, followed by mid-caps (+1.83%) and large caps (+0.91%) in May. During the first five months of 2025, large cap REITs have outperformed small caps by 817 basis points.

Source: Graph by Simon Bowler of 2nd Market Capital, Data compiled from S&P Global Market Intelligence LLC. See important notes and disclosures at the end of this article
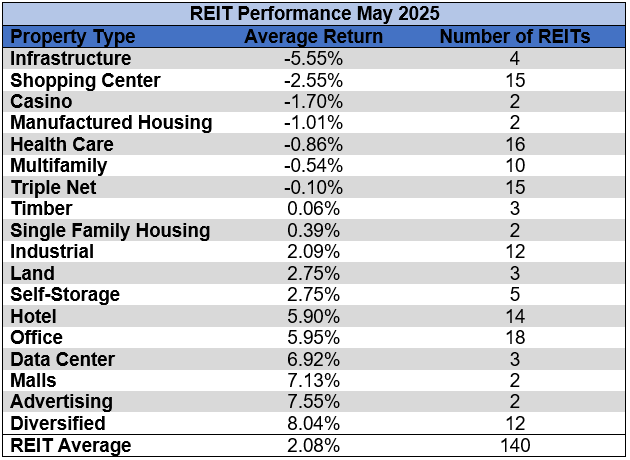
11 out of 18 Property Types Averaged Positive Returns in May
61.11% of REIT property types averaged a positive total return in May. There was a 13.6% total return spread between the best and worst performing property types. Diversified (+8.04%) and Advertising (+7.55%) were the best performing property types in May. Infrastructure (-5.55%) and Shopping Center REITs (-2.55%) underperformed.

Source: Table by Simon Bowler of 2nd Market Capital, Data compiled from S&P Global Market Intelligence LLC. See important notes and disclosures at the end of this article
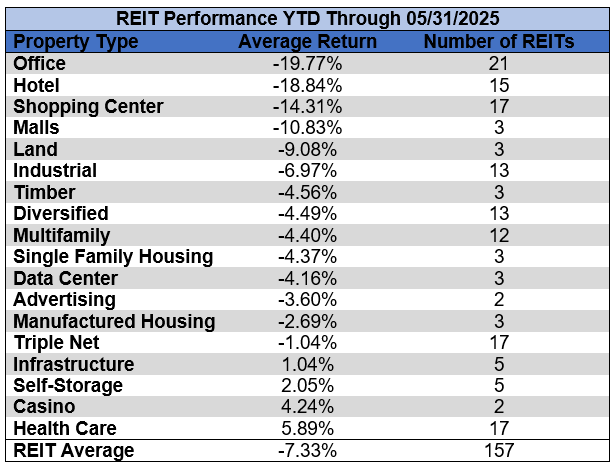
Even after solid gains in May, Office (-19.77%) and Hotel REITs (-18.84%) remain the worst performing REIT property types year-to-date. Despite underperforming in May, Health Care (+5.89%) and Casinos (+4.24%) remain the best performing property types thus far in 2025.

Source: Table by Simon Bowler of 2nd Market Capital, Data compiled from S&P Global Market Intelligence LLC. See important notes and disclosures at the end of this article
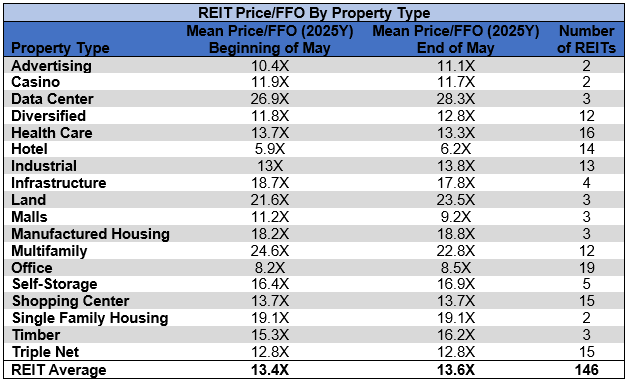
The REIT sector as a whole saw the average P/FFO (2025Y) increase 0.2 turns in May from 13.4x up to 13.6x. 50% of property types averaged multiple expansion, 33.3% averaged multiple contraction and 16.7% saw multiple hold steady in May. Data Centers (28.3x), Land (23.5x), Multifamily (22.8x), Single Family Housing (19.1x) and Manufactured Housing (18.8x) currently trade at the highest average multiples among REIT property types. Hotels (6.2x), Office (8.5x) and Malls (9.2x) are the only property types that average single digit FFO multiples.

Source: Table by Simon Bowler of 2nd Market Capital, Data compiled from S&P Global Market Intelligence LLC. See important notes and disclosures at the end of this article
Performance of Individual Securities
Paramount Group (PGRE) (+41.03%) had a rough start to the year, declining -13.18% over the first 4 months of 2025, but surged deep into positive territory in May. After market close on April 30th, PGRE posted an earning beat that included raised guidance for 2025 leasing activity and occupancy. PGRE then also announced on May 19th that it will be conducting a review of strategic opportunities to maximize shareholder value.
May’s share price collapse of Office Properties Income Trust (OPI) (-52.93%) was narrowly worse than that of perpetually free-falling Wheeler REIT (WHLR) (-50.56%), which has led the REIT sector downward the most months of 2025. After market close on April 30th, OPI posted dismal earnings, which showed a significant year-over-year decline in both FFO/share and occupancy. Increased cost of debt service and a spike in tenant lease non-renewals drove the poor results.
62.58% of REITs had a positive total return in May. REITs have averaged a -7.33% year-to-date total return in 2025, which slightly trails the -5.45% return for the REIT sector over the first 5 months of 2024.
For the convenience of reading this table in a larger font, the table below is available as a PDF as well.
Source: Table by Simon Bowler of 2nd Market Capital, Data compiled from S&P Global Market Intelligence LLC. See important notes and disclosures at the end of this article
Source: Table by Simon Bowler of 2nd Market Capital, Data compiled from S&P Global Market Intelligence LLC. See important notes and disclosures at the end of this article
Source: Table by Simon Bowler of 2nd Market Capital, Data compiled from S&P Global Market Intelligence LLC. See important notes and disclosures at the end of this article
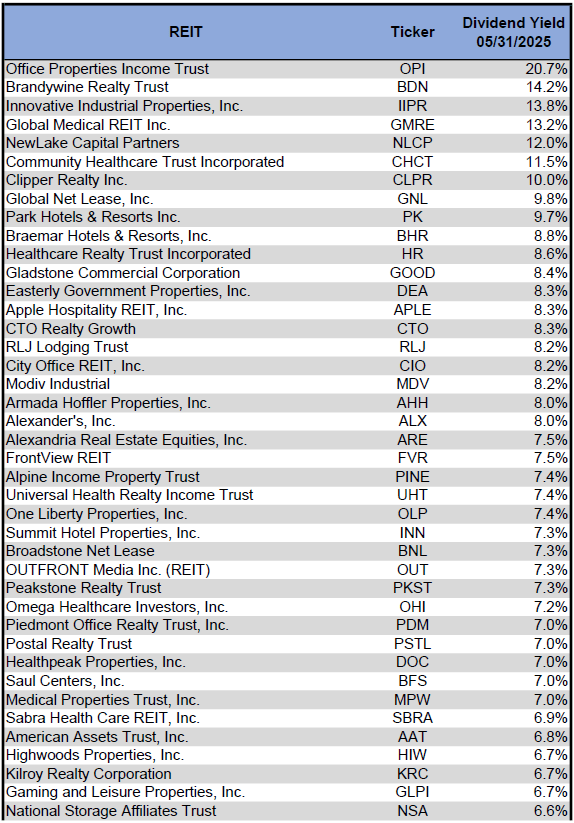
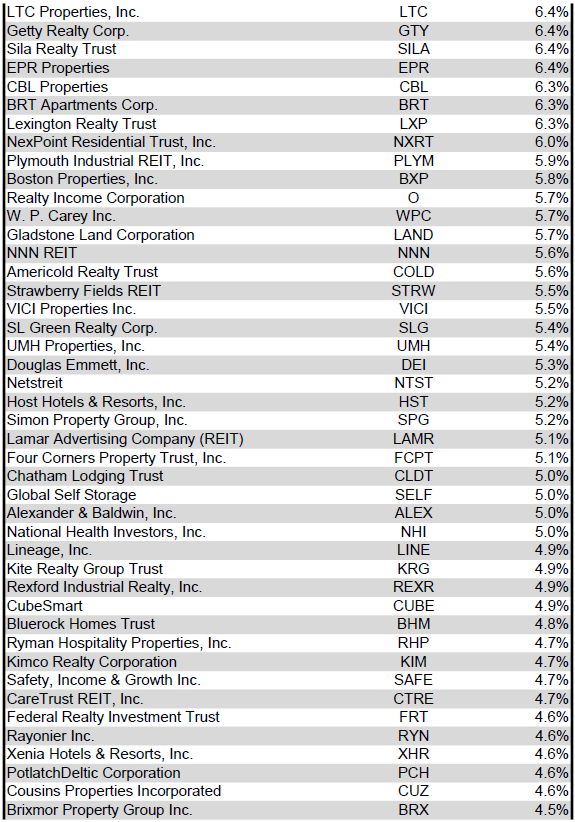
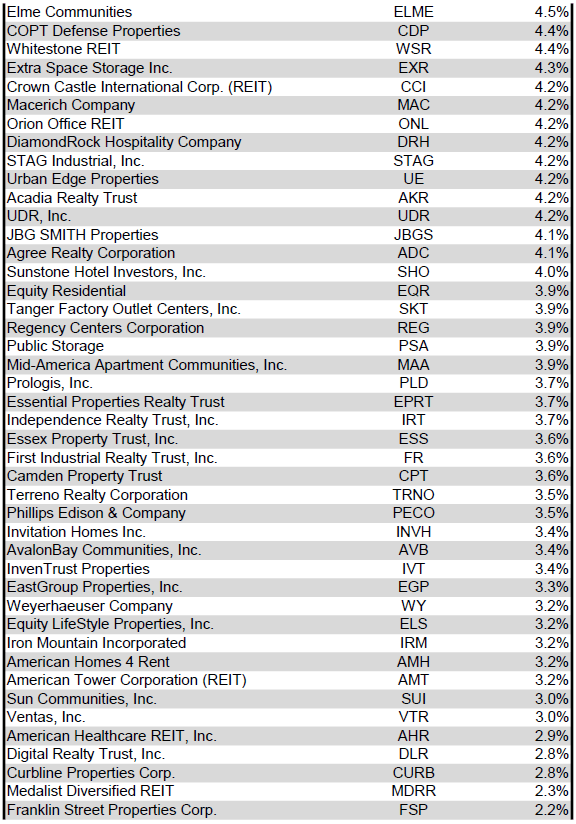
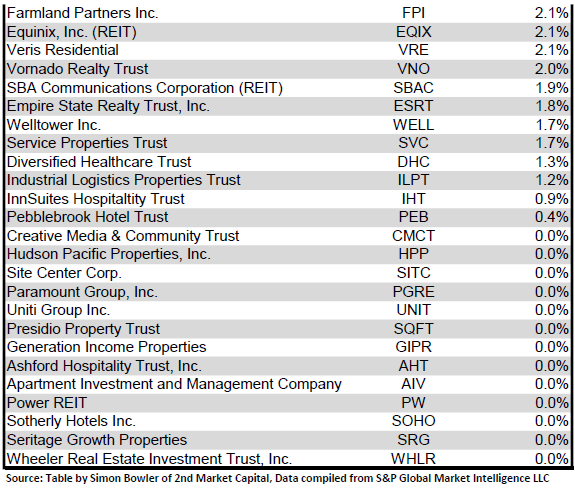
Dividend Yield
Dividend yield is an important component of a REIT’s total return. The particularly high dividend yields of the REIT sector are, for many investors, the primary reason for investment in this sector. As many REITs are currently trading at share prices well below their NAV, yields are currently quite high for many REITs within the sector. Although a particularly high yield for a REIT may sometimes reflect a disproportionately high risk, there exist opportunities in some cases to capitalize on dividend yields that are sufficiently attractive to justify the underlying risks of the investment. I have included below a table ranking equity REITs from the highest dividend yield (as of 5/31/2025) to the lowest dividend yield.
For the convenience of reading this table in a larger font, the table below is available as a PDF as well.

Source: Table by Simon Bowler of 2nd Market Capital, Data compiled from S&P Global Market Intelligence LLC. See important notes and disclosures at the end of this article

Source: Table by Simon Bowler of 2nd Market Capital, Data compiled from S&P Global Market Intelligence LLC. See important notes and disclosures at the end of this article

Source: Table by Simon Bowler of 2nd Market Capital, Data compiled from S&P Global Market Intelligence LLC. See important notes and disclosures at the end of this article

Source: Table by Simon Bowler of 2nd Market Capital, Data compiled from S&P Global Market Intelligence LLC. See important notes and disclosures at the end of this article
Although a REIT’s decision regarding whether to pay a quarterly dividend or a monthly dividend does not reflect on the quality of the company’s fundamentals or operations, a monthly dividend allows for smoother cash flow to the investor. Below is a list of equity REITs that pay monthly dividends, ranked from the highest yield to the lowest yield.

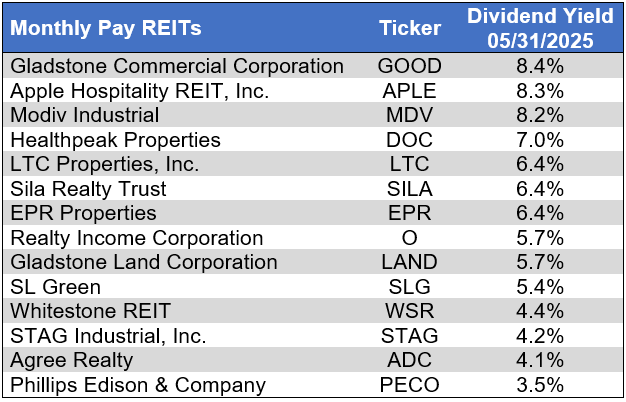
Source: Table by Simon Bowler of 2nd Market Capital, Data compiled from S&P Global Market Intelligence LLC. See important notes and disclosures at the end of this article
Dividend News
2 REITs announced quarterly dividend hikes in May: Independence Realty Trust (IRT) (+6.3%) and Gaming and Leisure Properties (GLPI) (+2.6%). In total, 41 REITs increased their dividend during the first five months of 2025.
Source: S&P Global Market Intelligence
Economic Health
The number of corporate bankruptcies remained elevated and increased month over month in May. There were more filings year-to-date in 2025 than in the first 5 months of any other year since 2010. There have been 15.9% more bankruptcy filings over the first 5 months of 2025 than during the same period in 2024.
Source: S&P Global Market Intelligence
Valuation: REIT Premium/Discount to NAV by Property Type
Below is a downloadable data table, which ranks REITs within each property type from the largest discount to the largest premium to NAV. The consensus NAV used for this table is the average of analyst NAV estimates for each REIT. Both the NAV and the share price will change over time, so I will continue to include this table in upcoming issues of The State of REITs with updated consensus NAV estimates for each REIT for which such an estimate is available.
For the convenience of reading this table in a larger font, the table below is available as a PDF as well.
Source: Table by Simon Bowler of 2nd Market Capital, Data compiled from S&P Global Market Intelligence LLC. See important notes and disclosures at the end of this article
Source: Table by Simon Bowler of 2nd Market Capital, Data compiled from S&P Global Market Intelligence LLC. See important notes and disclosures at the end of this article
Source: Table by Simon Bowler of 2nd Market Capital, Data compiled from S&P Global Market Intelligence LLC. See important notes and disclosures at the end of this article
Source: Table by Simon Bowler of 2nd Market Capital, Data compiled from S&P Global Market Intelligence LLC. See important notes and disclosures at the end of this article
Takeaway
The large cap REIT premium (relative to small cap REITs) widened in May and investors are now paying on average about 38% more for each dollar of 2025 FFO/share to buy large cap REITs than small cap REITs (17.8x/12.9x – 1 = 38.0%). As can be seen in the table below, there is presently a strong positive correlation between market cap and FFO multiple.
Source: Table by Simon Bowler of 2nd Market Capital, Data compiled from S&P Global Market Intelligence LLC. See important notes and disclosures at the end of this article
The table below shows the average NAV premium/discount of REITs of each market cap bucket. This data, much like the data for price/FFO, shows a strong, positive correlation between market cap and Price/NAV. The average large cap REIT (-3.63%) trades at a single-digit discount to consensus NAV, and mid-cap REITs (-11.28%) trade at a low double-digit discount. Small cap REITs (-27.91%) trade at just under 3/4 of NAV, while micro caps (-43.24%) trade at the deepest average discounts to their respective NAVs.
Source: Table by Simon Bowler of 2nd Market Capital, Data compiled from S&P Global Market Intelligence LLC. See important notes and disclosures at the end of this article
Despite Uncertainty Surrounding Trade, Economic Growth and the Timeline of Fed Rate Cuts, Retail Data is Encouraging
Massive Covid-era stimulus and mortgage refinances drove household debt service ratios sharply lower in 2020. This ratio has since largely rebounded, but remains lower than the stabilized pre-pandemic level. Despite record credit card debt and record total household debt in Q4 2024, the household debt service ratio remains fairly healthy due to household income gains.
Source: S&P Global Market Intelligence
Real disposable personal income growth steadily declined throughout 2023 and 2024, but has reaccelerated in 2025. An increase in disposable personal income provides consumers with the opportunity to spend more on goods and services, which is a very encouraging sign for potential gains in retail spending through the remainder of the year. Favorable trends in retail spending facilitate strong leasing for Retail REIT landlords, with potential gains in occupancy and rent per square foot on new and renewal leases.
Source: S&P Global Market Intelligence
May saw a disappointing -0.9% month-over-month decline in retail store sales, but year-over-year growth of +3.3% in retail and food service store sales. Monthly spending data in May may have been impacted by consumers stocking up in prior months ahead of the implementation of substantial tariffs. Furniture and home furnishing stores (+8.8%) and health and personal care stores (+7.7%) saw particularly strong year-over-year growth. The only categories to struggle were electronics and appliance stores (-1.9%) and building material and garden equipment and supplies dealers (-1.1%).
Source: S&P Global Market Intelligence
With some retail fundamentals showing signs of improvement, retail default risk saw an encouraging decline between mid-May (3.7%) and mid-June (3.5%). There were particularly strong improvements in drug retail (6.0% to 4.1%) and consumer electronics (6.6% to 5.4%). The retail segments with the lowest default risk were consumer staples merchandise retail (0.3%) and food retail (0.6%).
Source: S&P Global Market Intelligence
While retail real estate in general has multiple tailwinds that could benefit profitability and valuation over upcoming years, the outlook is even better for some retail REITs. REITs typically own higher quality assets with a higher percent of creditworthy tenants. Many retail REITs are also trading at significant discounts to net asset value, allowing for an attractive entry point. However, there is significant variance among retail REITs regarding quality of balance sheet, earnings growth, and tenant quality. As a result, it is essential for investors to either do their own due diligence before selecting which REITs to invest in or to hire an investment advisor who is capable of high quality REIT research and analysis.
Editor’s Note: This article covers one or more microcap stocks. Please be aware of the risks associated with these stocks.
Read the full article here